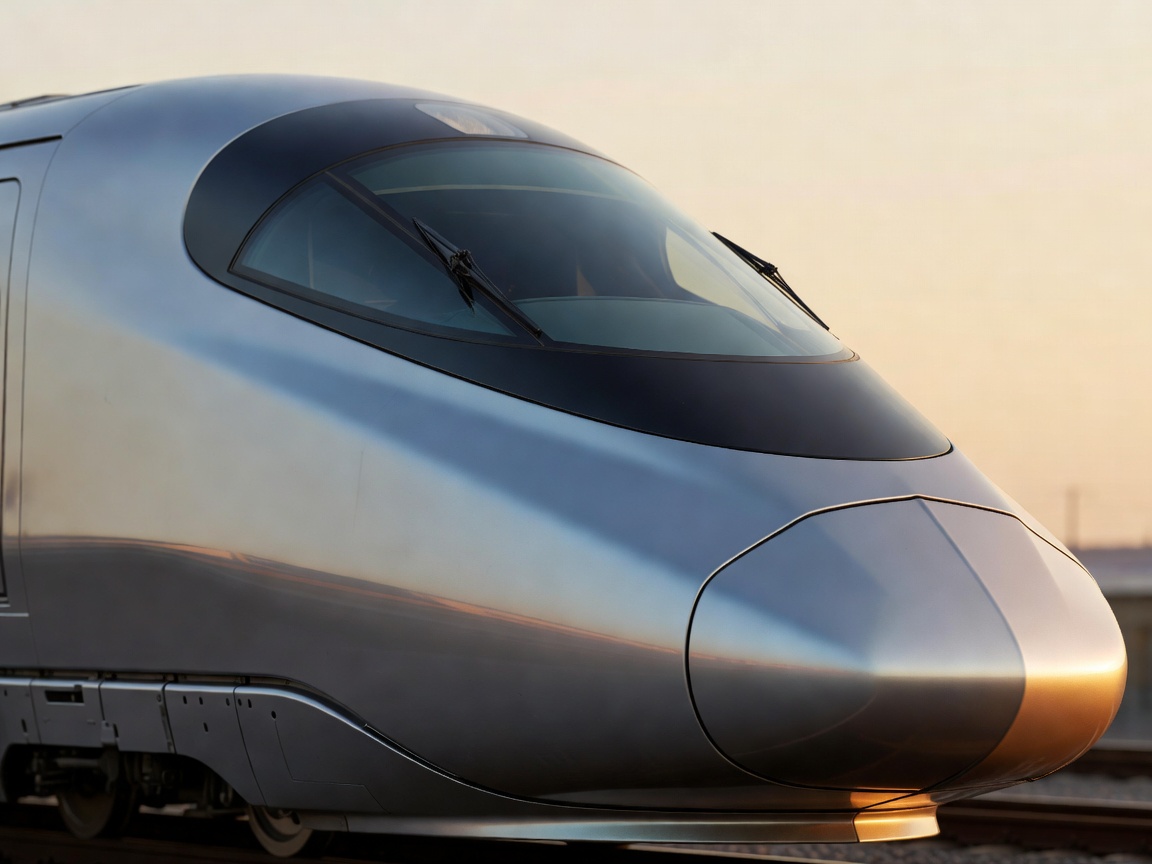
 Nose / Pressure gradient
A smooth beginning, not a universal answer
Compare a nose’s changing cross-sectional area with its visual silhouette. The two describe different things.
Investigate nose design →01 / A journey through the pressure field
A train does not simply cut through air. It raises pressure ahead, draws flow along its surfaces and leaves a moving wake. Efficient design means managing that entire journey—not just sharpening the nose.
Trace the airflow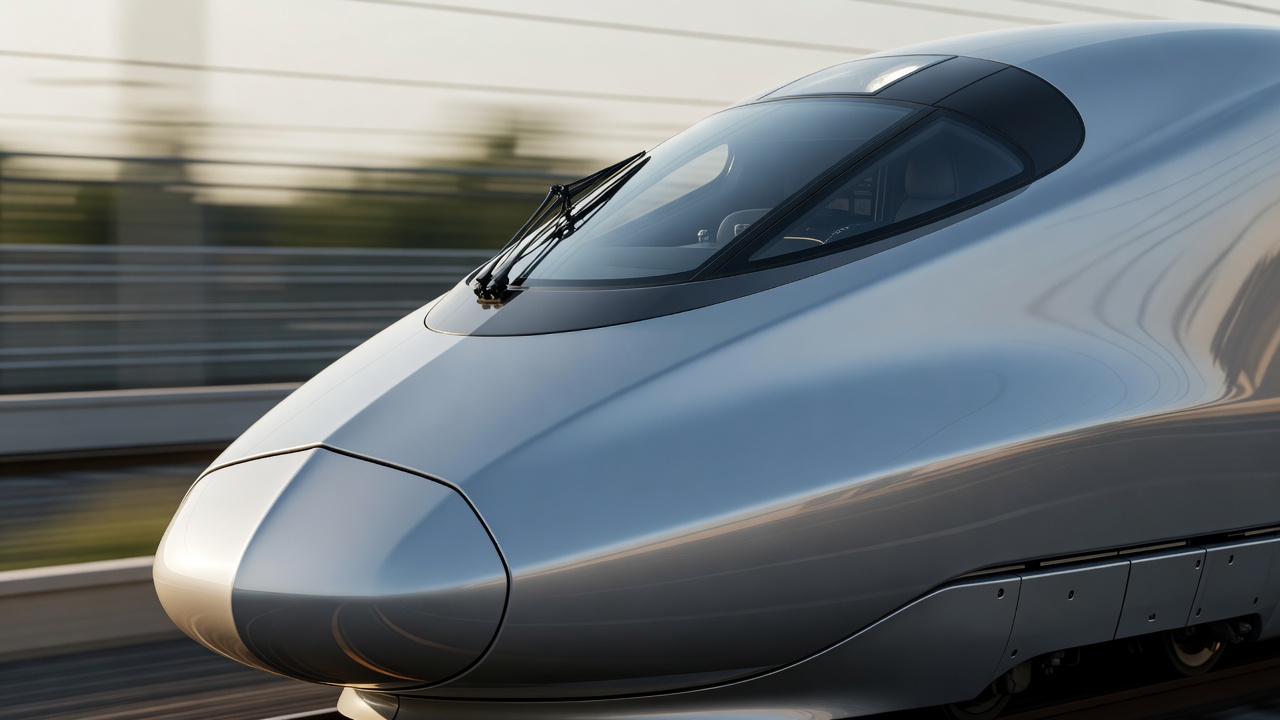
02 / Shape the first encounter
Long, gradual contours can spread a pressure rise over time. But loading gauge, driver visibility, usable space and tunnel conditions determine whether that extra length is worthwhile.
Nose / Pressure gradientCompare a nose’s changing cross-sectional area with its visual silhouette. The two describe different things.
Investigate nose design →03 / Trace the disturbed flow
Boundary layers thicken along the body. Recesses, bogies and roof equipment mix that air, changing drag, noise and the flow reaching the next component.
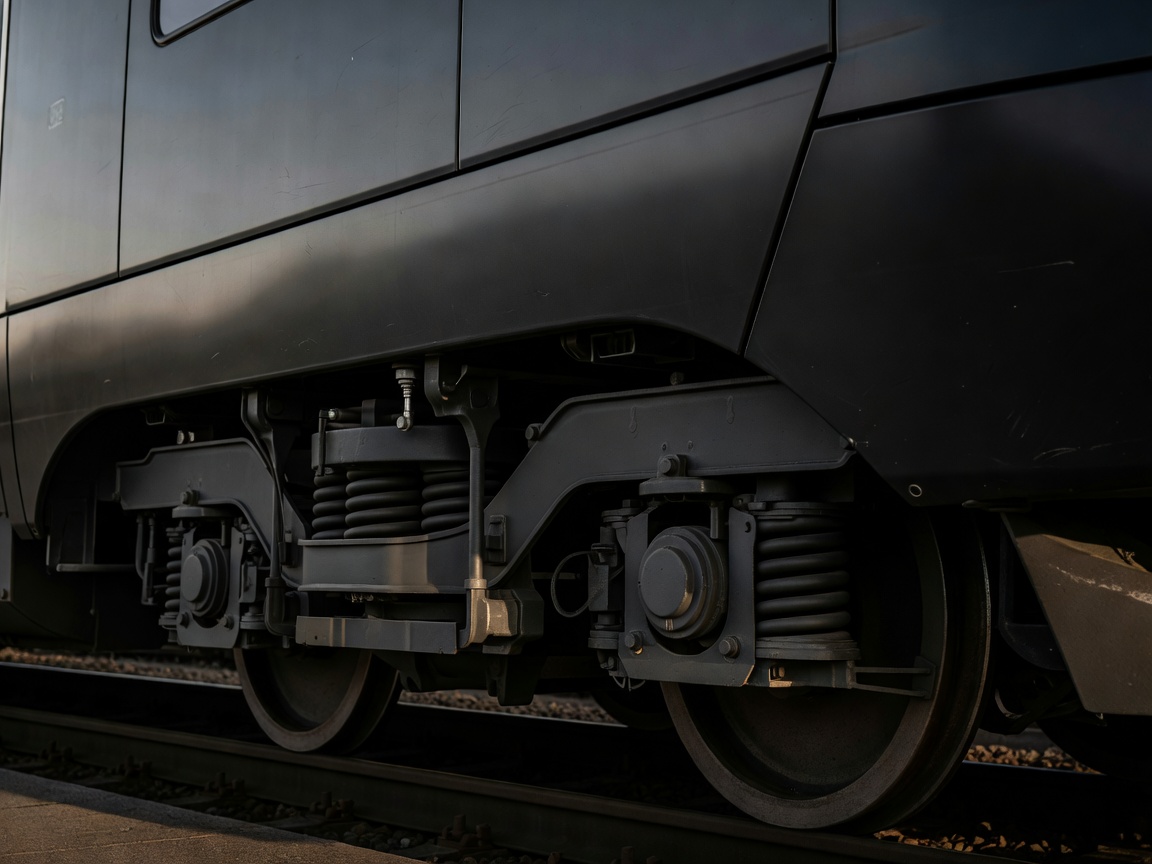 Underbody / Turbulence
A fairing that smooths one region must still allow suspension travel, ventilation, inspection and debris clearance.
Explore the underbody →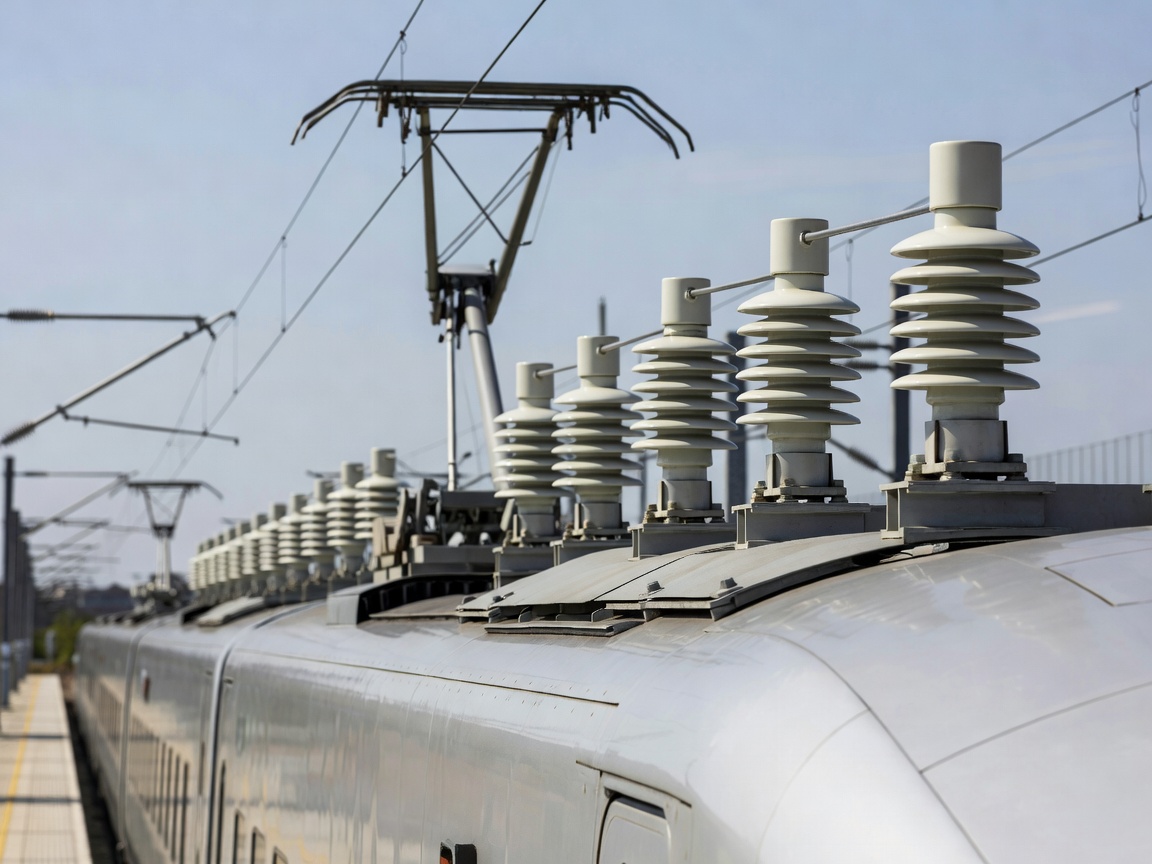 Roof / Flow disturbance
The pantograph must collect current reliably while exposed to turbulent, rapidly moving air.
Follow the roof flow →04 / Enter confined air
As the train enters, air can no longer escape freely in every direction. A compression wave runs ahead, reflects at openings and interacts with the train and tunnel geometry.
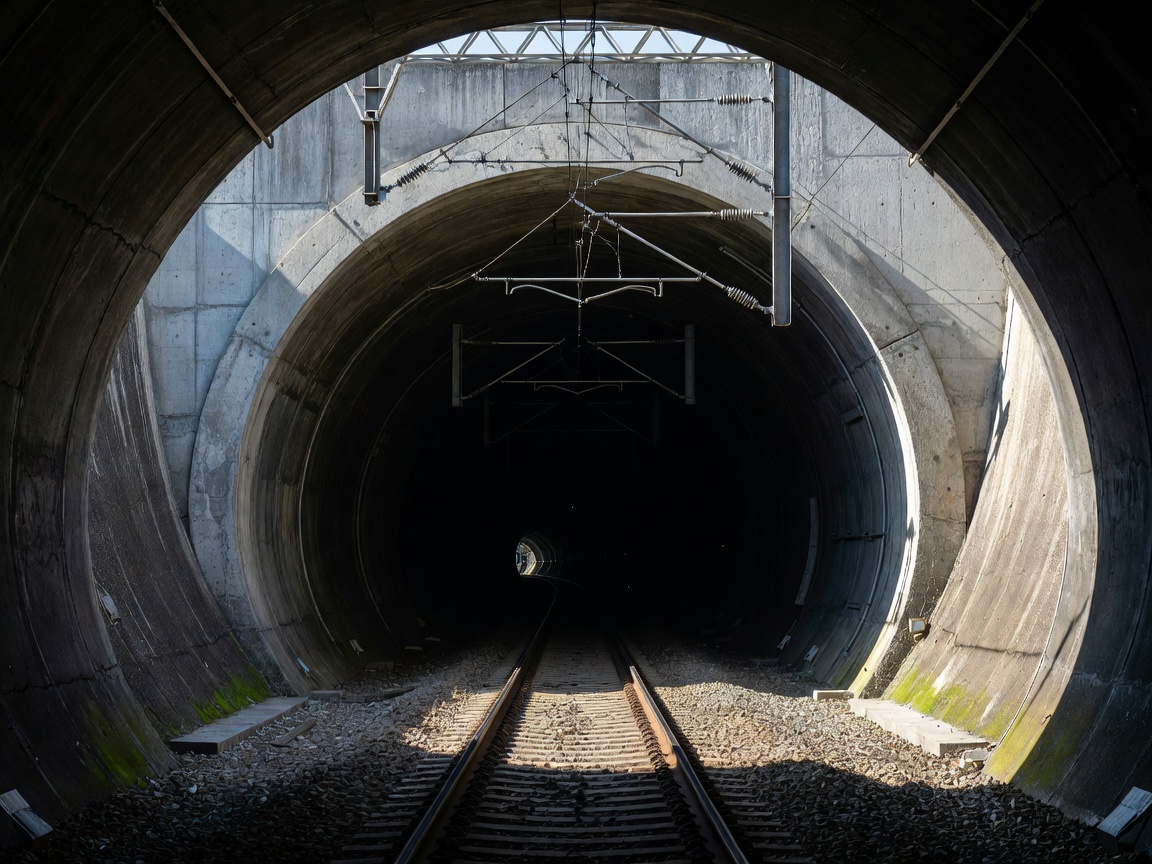 Tunnel / Confinement
Nose shaping, entrance hoods and tunnel cross-section address different parts of the pressure-wave problem.
Enter the tunnel study →05 / Count the trade-offs
Energy, aerodynamic noise, crosswind stability and maintainability belong in the same design conversation. A quiet roof component need not be the lowest-drag one.
Drag is a force. Power is the rate of doing work against it. Journey energy also includes acceleration, gradients, auxiliaries and what the electrical system can recover during braking.
Read the trade-off guide →At unchanged density, area and drag coefficient, increasing speed by 10% raises aerodynamic drag by 21% and the associated power by about 33%. That is not a prediction of total train energy.
See the assumptions and calculation →06 / Continue the investigation
Start with what changes: speed, pressure, geometry or the surrounding boundary. Then ask which evidence would separate one explanation from another.
Does a longer nose always help? What does a wind tunnel miss? Explore ten practical starting points.
Read the rail FAQ →Our reading notes distinguish physical explanations, conditional calculations and vehicle-specific evidence.
Explore the atlas method →Record the operating conditions and the uncertainty. Copy or download a note without sending it anywhere.
Open the worksheet →