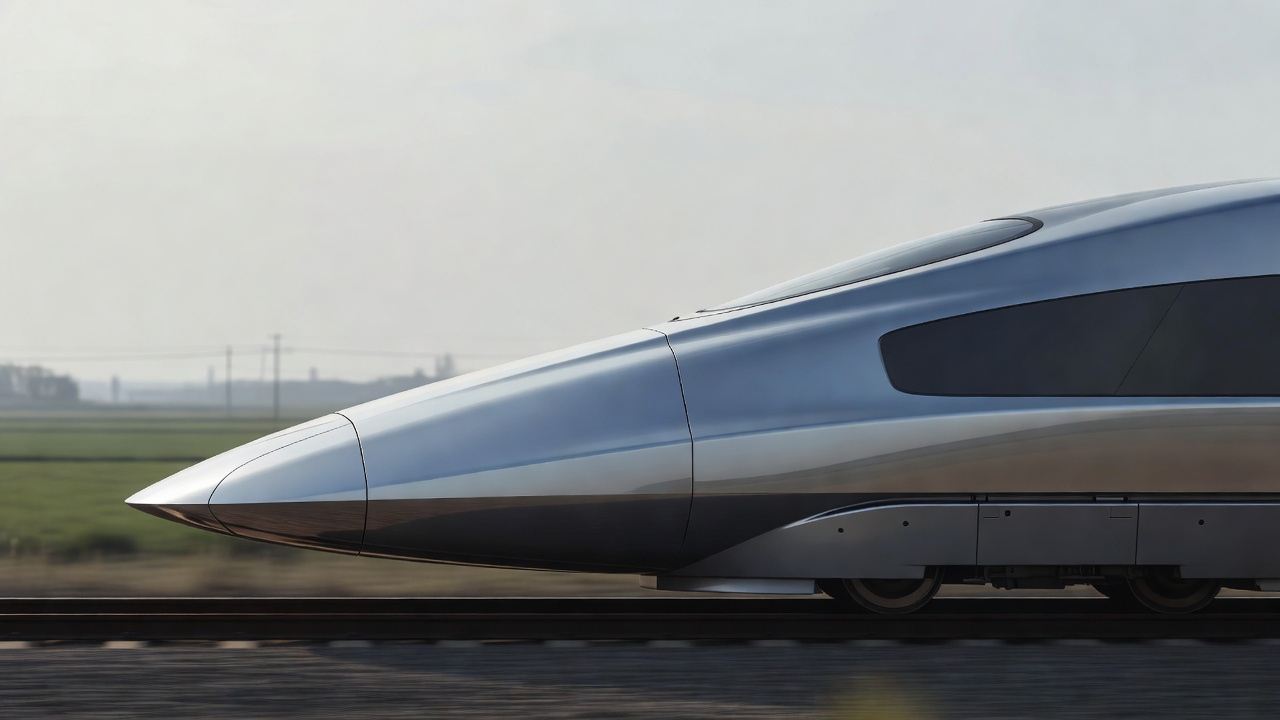
Begin with a pressure field, not a pointed tip
Imagine watching from a reference frame attached to a train travelling through still air. The air approaches the nose, slows near a stagnation region and turns around the body. Where it slows, static pressure rises; around other parts of the contour it accelerates and pressure can fall. The exact distribution depends on the three-dimensional geometry, the incoming flow and proximity to the ground. A side-view silhouette alone cannot reveal that distribution.
The forces generated by this pressure field act across the whole surface. Some oppose motion; others act vertically or sideways. Meanwhile, viscous shear acts along the skin. A train nose therefore cannot be judged only by whether it looks sharp. A narrow tip followed by an abrupt increase in cross-sectional area can still create strong pressure gradients. A blunter-looking design may distribute that increase more gently in three dimensions.
Why the rate of area change matters
A useful first question is how the train’s cross-sectional area grows with distance from its tip. A gradual growth can spread the displacement of air over a longer interval. In a tunnel, this is particularly important because the entering train generates a compression wave. The time history of that wave depends partly on how the nose introduces its area into the confined space. Nose length matters, but so does the distribution of area along that length.
This is not a claim that doubling nose length halves every pressure effect. Tunnel geometry, train speed, blockage ratio, portal design and the developing wave all intervene. Cross-sectional area is also only one description of a three-dimensional shape. A serious design comparison needs specified conditions and an agreed quantity to minimise: drag, peak pressure, pressure gradient, noise or some weighted combination.
Keep the flow attached where it matters
Air close to the surface is slowed by viscosity, forming a boundary layer. When that layer encounters a sufficiently strong adverse pressure gradient—a pressure increase in the flow direction—it may separate from the surface. Separation changes the pressure distribution and can produce unsteady structures. Smooth contour transitions can help, but there is no single curvature rule that guarantees attached flow under every yaw angle or operating condition.
The windscreen, wipers, coupler covers and transitions into the main body all complicate the ideal outline. A recessed fitting can contain recirculating flow. A sharp local edge can shed vortices. Engineers examine these details because a visually small feature can affect local noise or loads. They also need a practical coupler, driver sightlines, impact protection and reliable access for maintenance. Aerodynamic neatness is one requirement among several.
Read real trains as responses to real routes
The Shinkansen 500 Series and later E5 Series provide recognisable examples of elongated leading ends developed within Japan’s high-speed railway context. The E956 ALFA-X experimental train is another useful reference for investigating leading-end and high-speed design questions. Their existence does not establish a universal ideal nose. A train operating through numerous tunnels faces a different optimisation problem from one whose route has fewer confined sections.
Compare those examples with the Siemens Velaro family, the Alstom TGV Duplex and the Italian ETR 1000. They show that service speed alone does not determine the visible outline. Capacity, loading gauge, vehicle architecture, crashworthiness requirements and route infrastructure also shape the result. Comparing photographs can generate good questions, but it cannot establish a fair drag ranking: the trains differ in length, frontal area, equipment and operating conditions.
| Design change | Possible benefit | Constraint to check |
|---|---|---|
| Longer area transition | More gradual tunnel-entry displacement | Usable space and route-specific wave behaviour |
| Smoother fittings | Less local separation or tonal noise | Access, visibility and reliable operation |
| Modified side curvature | Changed pressure distribution in yaw | Crosswind loads and vehicle dynamics |
Test the shape, then test the explanation
Computational fluid dynamics can reveal pressure distributions and candidate separation regions. Wind-tunnel work can test force trends and local flow behaviour. Full-scale measurements can expose effects that a simplified model missed. Agreement between these methods builds confidence, but only when the comparison uses compatible geometry, ground treatment, reference conditions and uncertainty reporting. An attractive simulation image is evidence of a calculation, not automatically evidence of a validated design.
A useful reading habit is to ask what was held constant. Was the same body length used? Was the tail changed along with the nose? Was the result measured at zero yaw or across a range of crosswinds? Did the study assess open-air drag or tunnel pressure? These questions turn the nose from a styling object into an engineering experiment. Next, follow the air beyond the cab: the rest of the train may dominate the accumulated resistance.
Sources and further investigation
- Railway Technical Research Institute — research on railway aerodynamics and tunnel-related phenomena.
- East Japan Railway Company — operator information and technical publications on Shinkansen development.
- C. J. Baker and colleagues, Train Aerodynamics: Fundamentals and Applications, Elsevier — a technical reference for vehicle flow and testing.
- Siemens Mobility — high-speed vehicle context, not an independent performance comparison.